Statistics can seem scary and unapproachable: maybe math was not always your strongest subject or you’re still processing the trauma of by-hand ANOVAs in undergraduate statistics classes. Luckily, this blog is designed to help you make friends with statistics and move forward with your research. Specifically, I’ll focus on resources to help guide you through: 1) deciding which statistical analyses to run for a given question and 2) tools to use to run those statistical analyses.
Part 1: Choosing an appropriate statistical analysis
Step 1: Be familiar with commonly-used statistical analyses.
- This free online self-paced course covers correlations, probability, confidence intervals, and significance tests.
- This free online self-paced course covers regression, comparing groups, ANOVA, and non-parametric tests.
- CenterStat provides free videos on youtube, including Structural Equation Modeling (or sign up for a free live class!)
- They also offer classes on a wide range of more advanced statistics topics for a fee on their website.
- If you prefer written information, Professor Peggy Kern created very helpful handouts!
Step 2: Choosing a statistical analysis to address your question.
- You should consider whether the outcome of your analysis is addressing your research question. For example, if you did a correlation but you don’t know what the r value means for your research question, then you have wasted your time.
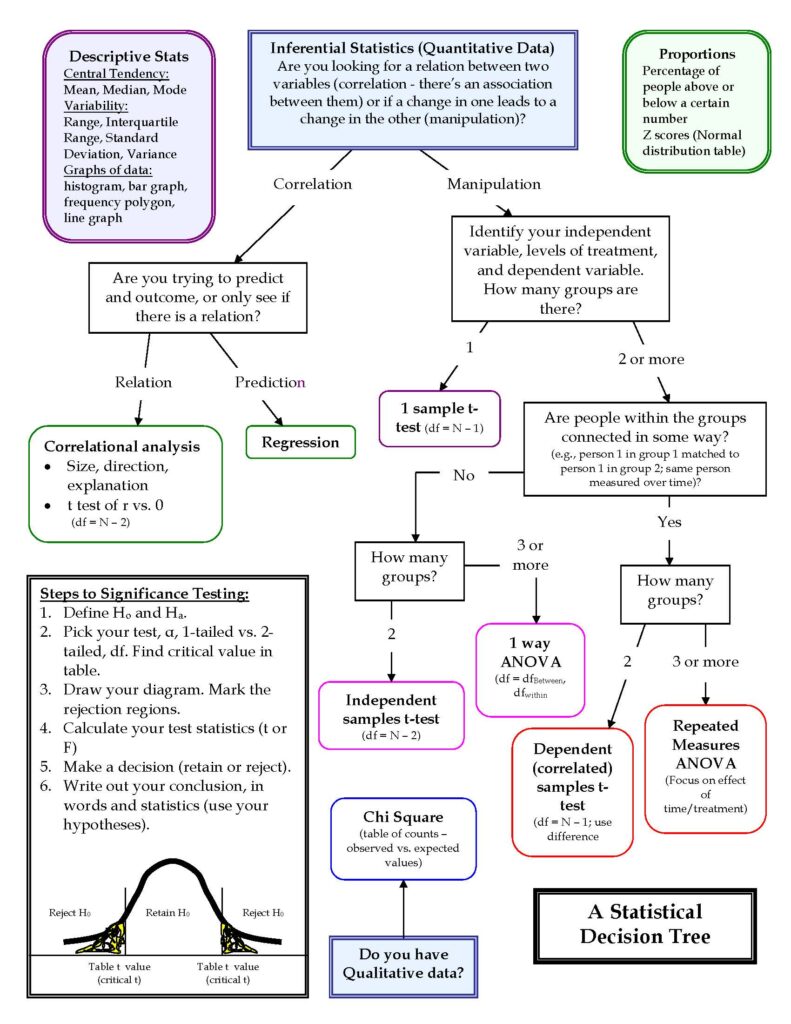
- You also want to make sure that your research design/methods meet the requirements for the statistical test. For example, if you wanted to do an independent samples t-test but only have 1 group, then you are using the wrong test.
- Decision trees can help visualize how to narrow down which test to use and what aspects to consider when choosing a test.
Source: https://www.peggykern.org/uploads/5/6/6/7/56678211/edu90790_decision_chart.pdf

Part 2: Using Statistical Software
- Your University may have access to statistical software such as SPSS, SAS, and Matlab. In addition, R is free to download on their website and provides powerful statistical computing and graphics.
- Since it’s open source there are plenty of resources available to help you learn R!
- R has manuals.
- This free online self-paced course has an introduction to the basic syntax
- To make some awesome figures, this free online self-paced course introduces you to R’s gglplot.
- See how a standard plot is transformed into an amazing figure through this evolution of a ggplot by Cédric Scherer.
- Also check out this extensive R resources roundup by Dr. Dan Mirman including books, cheat sheets, tutorials, and more!
- Since it’s open source there are plenty of resources available to help you learn R!
In conclusion, statistics are a powerful tool to use in research. With the right support, you too can learn to use it appropriately and effectively. Do not rush into running statistical tests, but first assess whether the test is appropriate. Learning a new statistical software, like R, takes time. Don’t be discouraged if you are learning it slowly, the best way to learn is to try!
Best of luck on your statistical journey!
